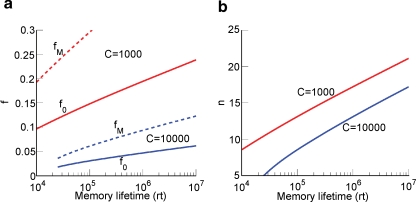
Figure 4.
Relation between sparseness and memory lifetime. (a) The minimal and the optimal sparseness (f0 and fM, respectively) are plotted against a desired memory lifetime for C = 1000 (red) and C = 10 000 (blue). As memory lifetime increases, the number of needed metaplastic states n also increases (b), and this imposes an upper bound on the sparseness (a lower bound on f).

