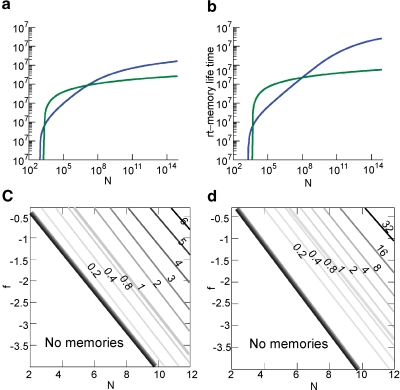
Figure 6.
Comparison of the memory lifetime of the cascade (in blue) and the multistate model (in green) for f = 0.1 (a) for n = 10 (b) and n = 15. (c) Ratio of the memory lifetime of cascade over multistate model as a function of N and f for n = 10 (N and f are in Log10 base). The graded black area corresponds to the range in which the cascade has much higher memory capacity. (d) The same as above for n = 15.

