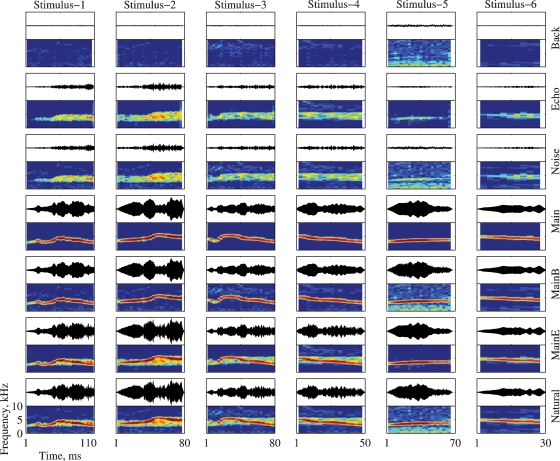
Figure 1.
The bird song stimuli and their modifications. Each version is represented both as an oscillogram and as a spectrogram. The frequency range for all spectrograms is 0–10 kHz. All spectrograms share the same color scale (covering a range of 60 dB), and all the oscillograms share the same scale. The time scale is identical for all versions of the same stimulus (in columns). The versions and their relationships are (from bottom to top): Natural (Main + Echo + Background), Main + Echo, Main + Background, Main, Noise (Echo + Background), Echo, and Background.

