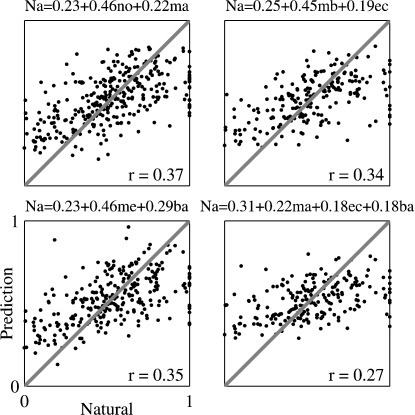
Figure 11.
Scatter plots of the responses to Natural against the predictions of the linear regression equations. The linear regression coefficients were computed using the entire neuronal population. The equation of the linear regression is shown on top of each plot. The correlation coefficient between the resulting predictions and the actual responses is shown in each plot; it is adjusted for the effects of neurons, stimuli and versions. Na, me, mb, ma, no, ec, and ba represent the normalized responses to Natural, Main Echo, Main Background, Main, Noise, Echo, and Background respectively.

