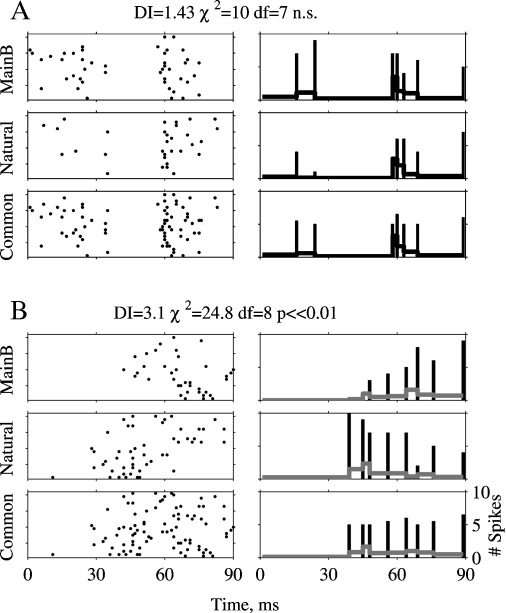
Figure 3.
Calculation of the DI. A and B are two examples of a χ2 test. The left column displays responses to 20 presentations of Natural and of Main Background, and their superposition, Common. The right column represents the PSTHs computed using the non-uniform bins selected as described in the text. The bars are the spike counts per bin displayed at the end point of each bin, and the gray line is the PSTH, computed by dividing the spike counts per bin by the bin duration. Scales are the same in all panels.

