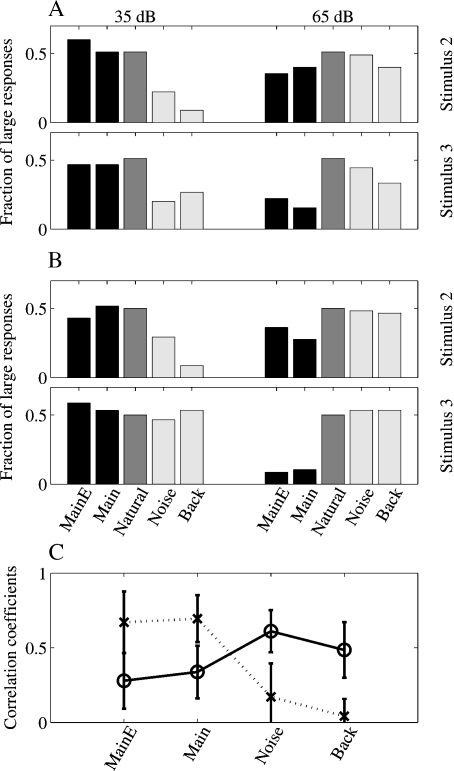
Figure 8.
Quantitative analysis of the responses in the mapping experiments. (A, B) Percentages of large responses in the two mapping experiments, for stimuli 2 and 3. The middle bar (dark gray), representing the fraction of large responses to Natural, is always at 50%, the selected breakpoint between large and small responses. The two left bars in each group (black) represent the large responses to Main Echo and Main, the other two stimuli in the mapping experiments that contained the Main component. The two right bars in each group (light gray) represent the large responses to Noise and Background, the two stimuli in the mapping experiments that did not contain the Main component. (C). Average correlation coefficients between the response maps to Natural and to the other four stimulus versions used in the mapping experiments. Dotted line: maps at 35 dB, continuous line: maps at 65 dB. The error bars represent standard deviations.

