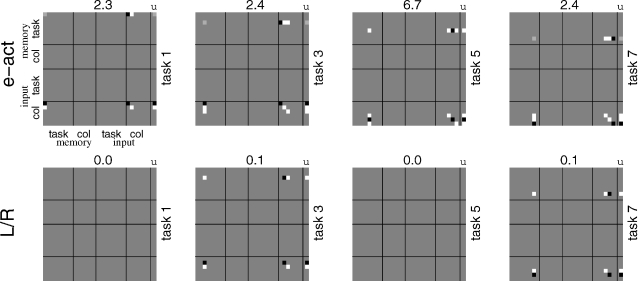
Figure 4.
Rules for CIOM. These plots use the same form as in Figure 3 to show the rules for the two key output units, e-act and L/R. The rules are simple in form, since they only concern individual rules, and also do not need to handle the additional matching conditions.

