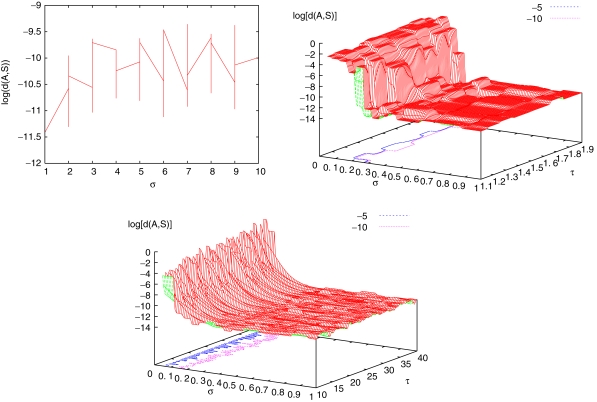
Figure 7.
Average value of log[d(Ω, )] for the model I (left) σ ∈[1, 10], τL ∈[10, 40]ms. We present here a projection in the plane σ, log[d(Ω, )], and the vertical bars correspond to the variations with τL. It allows us to verify the stability of the previous result for higher variability of the synaptic weights. (middle) τL∈[1, 1 ,…, 2]ms below the usual 20 ms value, σ∈[1, 10]. Such range corresponds to cortical neurons in high-conductance state. It allows to check the behavior of d(Ω, ) in this case. (right) Sampling period of 1 ms, in order to verify the robustness of the numerical results with respect to the sampling rate.

