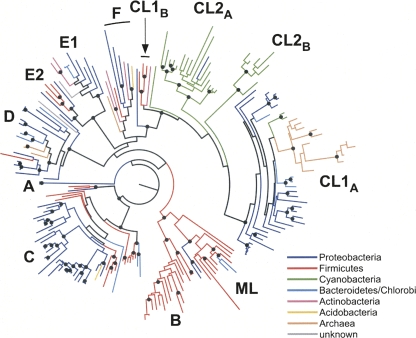
FIGURE 4.
Distribution of group II introns in bacteria. The intron-encoded ORF phylogeny is presented as a radial phylogram with the groups of host bacteria coded by color. Black dots indicate nodes with ≥70% bootstrap support. The phylogeny is identical to the one shown in Figure 2.

