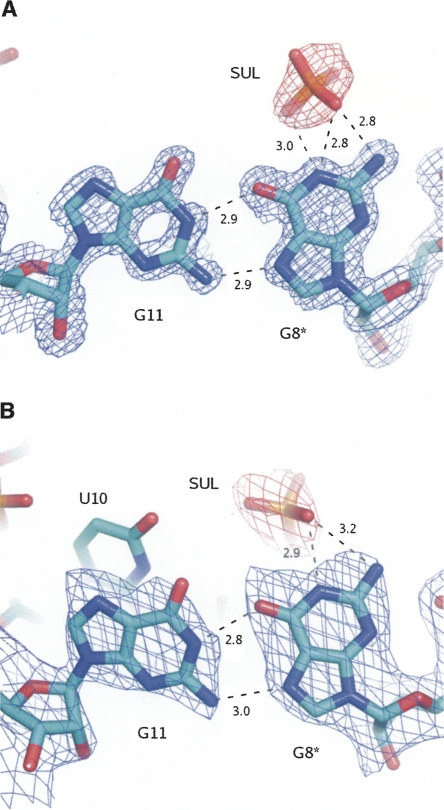
FIGURE 3.
The interactions within the G11(anti)–G8*(syn) pair and the sulphate ion, for the monoclinic (A) and the rhombohedral structures (B). The blue contours are for the 2Fo-Fc electron density maps at 1σ level and the red contours are for the omit difference maps at 2.8σ level. The star denotes the symmetry related RNA strand.

