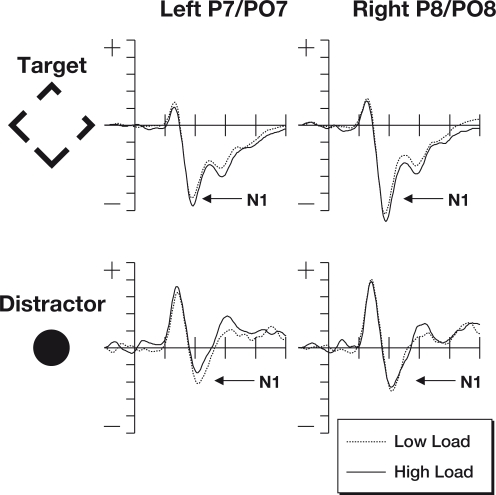
Figure 3.
The N1 components from this study. Note that the increased perceptual load results in larger N1 responses to target stimuli, but that there is a decrease to distractor stimuli. The top row of plots shows ERPs to the target stimuli where the participant was expected to make a gap judgment. The lower row shows ERPs to the irrelevant but salient central distractor stimuli. The horizontal axis shows time, beginning 100 ms prior to stimulus onset and continuing until 500 ms after onset, while the vertical axis shows the voltage (with a range from +5 to −5 μV). The solid line represents the ERP during periods of high perceptual load while the dotted line shows responses during sequences of low perceptual load.

