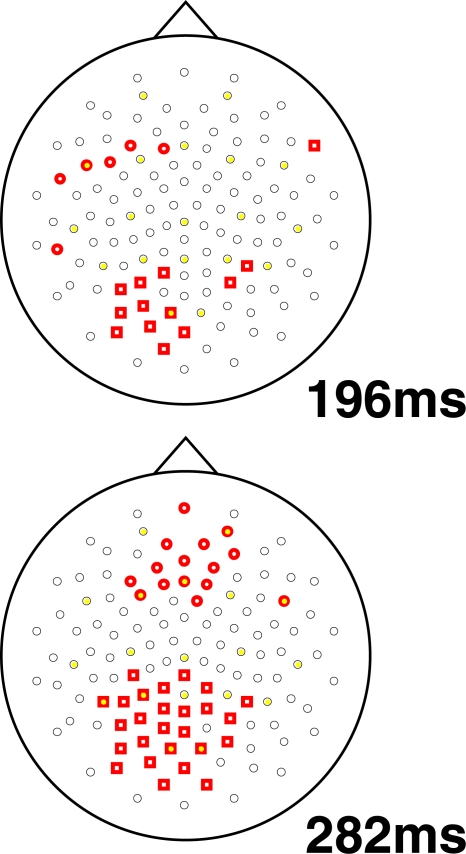
Figure 4.
Topographic maps of statistically significant interaction effects observed in this study. Two difference waves were computed: one for irrelevant stimuli (high–low load) and one for target stimuli (again, high–low load). The resulting difference waves were compared using a t-test for each electrode at each time point, with a threshold of p < 0.05. The plots show all electrodes, with significant electrodes shown in bold: bold squares show regions with more negative deflection for this interaction while bold circles show positive deflections. In other words, the squares show regions where increasing load is related to stronger N1 amplitude for target versus irrelevant stimuli. Two representative time points are shown: one at 198 ms and one at 282 ms.

