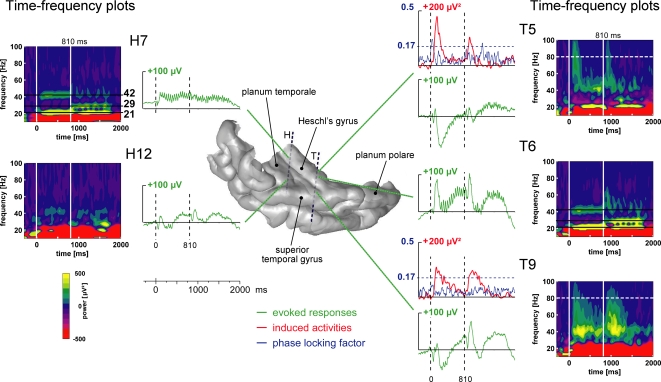
Figure 2.
Illustration of the typical electrophysiological responses and their location in the 3D rendering of the temporal cortex (1-stream condition in patient #4). Evoked responses (obtained by single-trial averaging) are plotted in green. Transient and sustained evoked responses were observed at most of the electrode contacts located in the superior temporal plane: in the Heschl's gyrus, HG (electrode contacts H7, T5 and T6), in the superior temporal gyrus, STG (T9) and in the planum temporale, PT (H12). The time–frequency plot of these activities (time–frequency power averaged after a wavelet-based analysis on each single trial) permits a good visualization of both evoked steady-state and gamma induced oscillations. Twenty-one hertz, 29 and 42 Hz steady-state evoked activities were found in the posteromedial part of the HG (H7) and more anteriorly in the HG (T6). Induced gamma oscillations were found in the anterior part of the HG (T5) and on the lateral STG (T9). The time profiles of induced activities at 80 Hz are depicted in red. When evoked and induced activities were present at the same place, in the same frequency band (see T5 as an example), the phase-locking factor indicated which activities were evoked (phase-locked to the stimulus: PLF > 0.17). The time profiles of the phase-locking factor at 80 Hz are depicted in blue. All these responses are baseline corrected with respect to the prestimulus period preceding part 1 onset.

