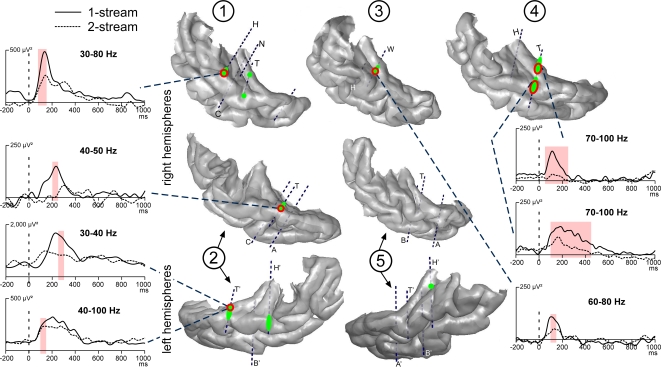
Figure 5.
Emergence and modulations of induced gamma oscillations on the 3D rendering of individual temporal cortices. Emergence of induced gamma oscillations after the onset of part 2 (0 ms) is depicted in green. Induced gamma oscillations were emerging quite laterally in the HG and STG. They were found more prominent in the 1-stream condition, in four patients (‘1-stream > 2-stream’, red circles). At each electrode contact, significant effects were found in a specific frequency band. The gamma power time profiles of the corresponding frequency bands are plotted (significant differences are indicated by light-red shaded areas). The power of these oscillatory activities is baseline corrected with respect to the (−250, −150 ms) period preceding part 1. Each number corresponds to a patient, patients #2 and 5 being implanted in both hemispheres.

