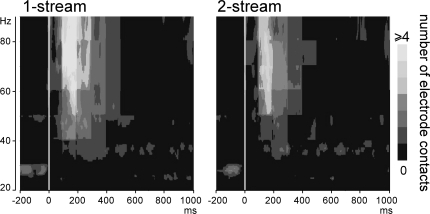
Figure 6.
Emergence of induced gamma oscillations after the onset of part 2 (0 ms). Representation, in the time–frequency domain, of the mean number of electrode contacts across patients which presented significantly emerging induced gamma oscillations. By means of a time–frequency criteria based on the stimulus phase-locking factor (PLF), only non-phase-locked induced activities are represented here. These activities were most frequently present between 100 and 350 ms in the 50–90 Hz frequency band.

