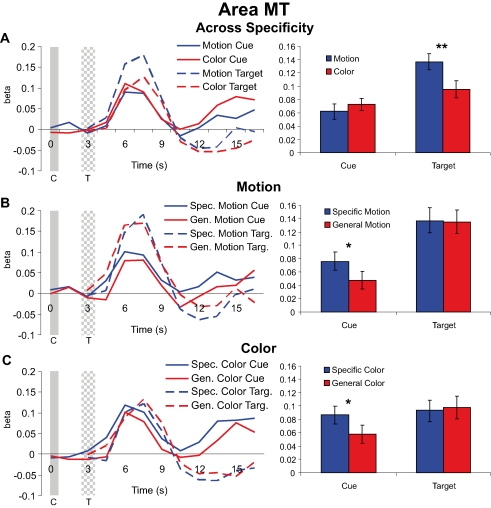
Figure 4.
Cue and target responses in area MT. Left column shows BOLD response time course estimates (beta weights) in MT. The solid and checkered gray bars represent the cue (C) and target (T) onsets and offsets, respectively. The right column shows the amplitudes of cue and target responses averaged over the three TRs around the peak of the hemodynamic response (see “Materials and methods” section). All individual cue and target responses are significantly different from the zero baseline. (A) Hemodynamic responses collapsed across specific feature and general dimension trials for motion and color cues and targets in MT. Although cue responses for motion and color conditions were not significantly different, there was a significant difference in target processing with attention (cued and attending for motion vs. color) in MT. Note that because the stimulus displays were identical for motion and color attention conditions, differences in target processing between motion and color reflect the effects of feature-based attention and not merely differences in selectivity for motion vs. color stimuli in MT. (B) Hemodynamic responses for motion specific feature and general dimension cues and targets in MT. The selective attention (cuing) effect here is the difference between the informative specific feature cue trials (for cues and targets) and the non-informative general dimension cue trials (for cues and targets). (C) Hemodynamic responses for color specific feature and general dimension cues and targets, also in MT.

