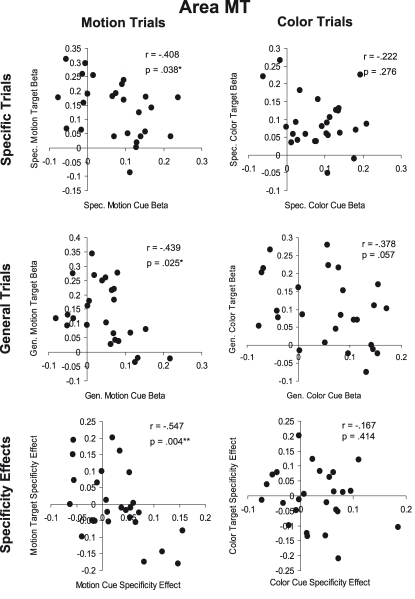
Figure 6.
Cue-target correlations in area MT. The top row (Specific Trials) shows the correlation between specific feature cues and targets for motion (left) and color (right) attention conditions. The middle row (General Trials) shows the correlation between general dimension cues and targets for motion and color attention conditions. The bottom row (Specificity Effects) shows the correlation between cues and targets for the effect of cue information (specific feature cue minus general dimension cue) for motion and color attention conditions.

