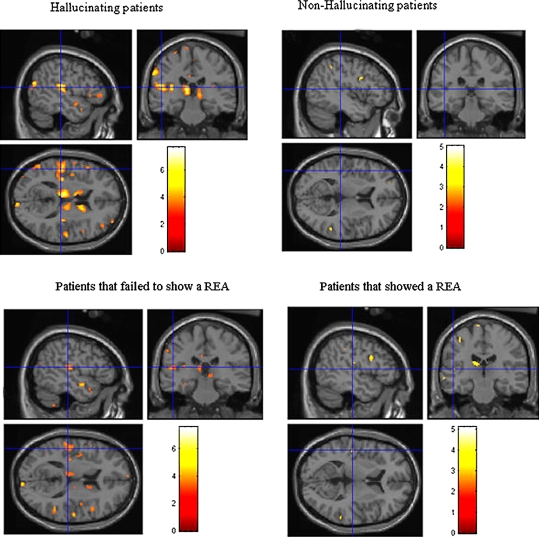
Figure 6.
Colored areas show significant reductions in grey matter density in the schizophrenia patients compared to healthy control subjects. The upper panel shows the sub-group of hallucinating (left) and non-hallucinating (right) patients compared to controls. The lower panel shows the sub-groups of patients that failed (left) respectively managed (right) to show a REA on a dichotic listening test.

