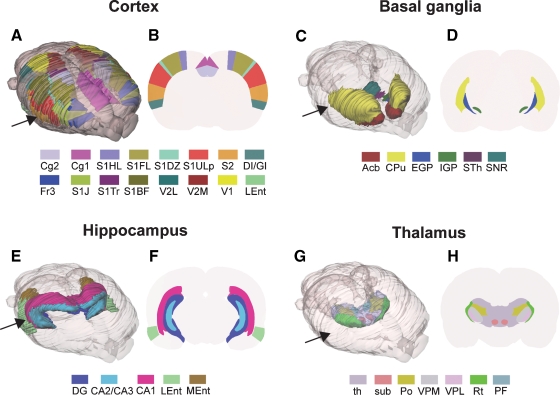
Figure 2.
Examples of rat brain regions included in the 3-D rat brain atlas. (A–H) Atlas representations of four major brain regions visualized as solid, color coded 3-D surfaces within the transparent outer surface of the brain, and as corresponding 2-D coronal slices, obtained from anteroposterior levels indicated by arrows. (A, B) 16 selected cerebrocortical brain regions. (C, D) Major regions of the basal ganglia. (E, F) Hippocampus and entorhinal cortex. (G, H) Selected sub-regions of the thalamus. In (G) thalamus (th)is made transparent in order to visualize the underlying sub-regions. Cg2, cingulate cortex area 2; Cg1, cingulate cortex area 1; S1, primary somatosensory cortex; S1HL, hindlimb region; S1FL, forelimb region; S1DZ, dysgranular zone; S1ULp, upper lip region; S2, secondary somatosensory cortex; DI/GI, insular cortex; Fr3, frontal cortex, area 3; S1J, jaw region; S1Tr, trunk region; S1BF, barrel field; V2L, secondary visual cortex, lateral area; V2M, secondary visual cortex, medial area; V1, primary visual cortex; Lent, lateral entorhinal cortex; Acb, accumbens nucleus; CPu, caudate putamen; EGP, external globus pallidus; IGP, internal globus pallidus; STh, subthalamic nucleus; SNR, substantia nigra; DG, dentate gyrus; CA2/CA3, field CA2 and CA3 of the hippocampus; CA1, field CA1 of the hippocampus; LEnt, lateral entorhinal cortex; MEnt, medial entorhinal cortex; th, thalamus, whole region; sub, submedius thalamic nucleus; Po, posterior thalamic nucleus; VPM, ventral posterolateral thalamic nucleus; VPL, ventral posteromedial thalamic nucleus; Rt, reticular thalamic nucleus; PF, parafasicular thalamic nucleus.

