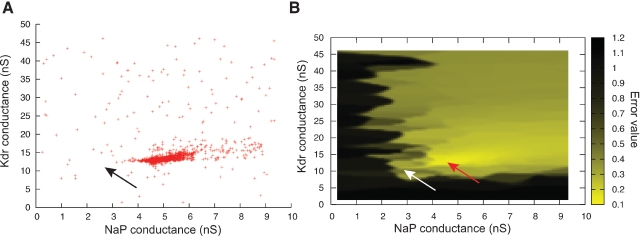
Figure 10.
ES search using Equation (1) in the phase-plane trajectory density method. (A) Plot of points in the solution space evaluated by Neurofitter during an Evolutionary Strategies search (6000 evaluations) to tune the pacemaker model using Equation (1) for the phase-plane trajectory density method. Every red point represents 1 evaluation. ES is not able to escape a deep region (B) Interpolated plot of the error values calculated by Neurofitter during the ES search in (A). The global optimal solution with error value 0 is shown by the black and white arrows, but the ES algorithm is not able to escape a local minimum (red arrow) around and . Remark that plot B does not show a complete representation of the error landscape, but only the shape as seen by ES.

