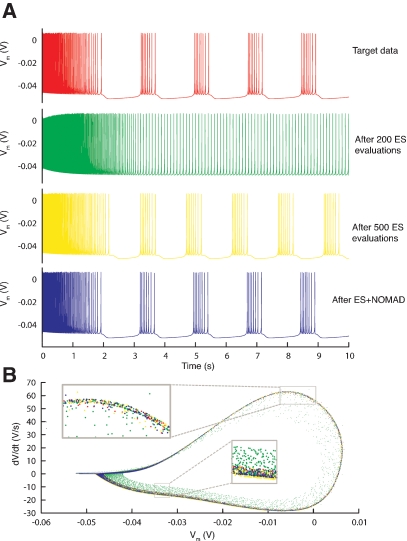
Figure 11.
Resulting traces. (A) Somatic membrane voltage traces of the target data (red), the best model found by an ES optimization after 200 (green) and 500 (yellow) evaluations, and by a NOMAD search that started with the best solution found by ES (blue). The respective error values are 0, 6.7, 4.1, and 2.6. (B) Phase-plane trajectory of the traces in A (same color code). The density of the trajectory is not visible, since one location on the plot can contain many overlapping data points.

