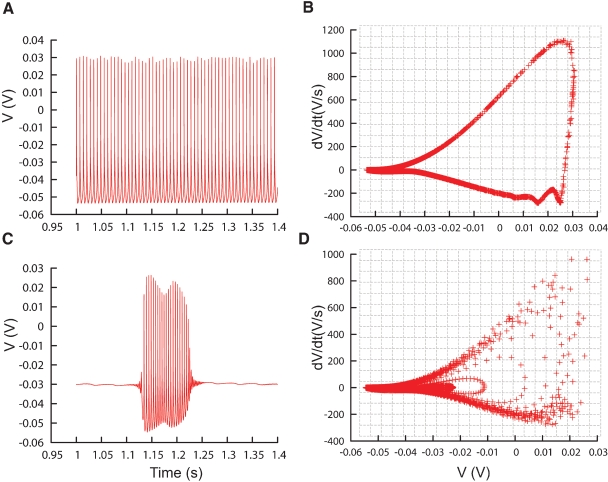
Figure 6.
Phase-plane trajectory density plots. (A) Traces recorded from the PC model (De Schutter and Bower, 1994) during constant current injection of 0.5 nA, causing the model to tonically fire action potentials. (B) V–dV/dt plot corresponding to the trace in (A), data sampled every 0.02 ms. Gray lines show the bins of the 2D histogram used by the phase-plane trajectory density method. In every bin the number of plot points is counted, the counts are then combined in Equation (1). (C, D) Similar to A and B, except that the model is injected with a current of 3 nA, causing it to burst. The V–dV/dt plot shows different trajectories corresponding to different action potential shapes.

