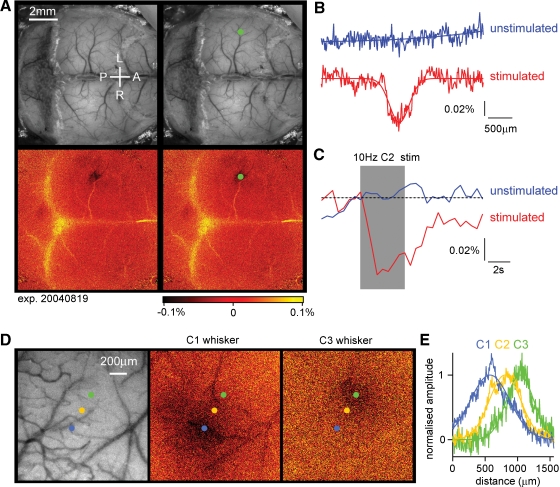
Figure 3.
Intrinsic imaging to identify the location of functional cortical columns. (A) A large fraction of the dorsal mouse brain is visualized with green light penetrating through the intact skull covered with Ringer solution and a glass cover slip (upper images). Under red light illumination, the right C2 whisker is deflected at 10 Hz for 4 seconds and the change in reflected light imaged (lower images). The evoked brain activity causes hemodynamic changes, which under our experimental conditions are imaged as reduced reflected red light in the active region on the left side of the brain. The functionally identified location of the C2 barrel column is shown as a dark area (lower images), which is labeled by a green dot (right images). The C2 column in this mouse was located 1.6 mm posterior and 3.3 mm lateral to Bregma. The yellow color indicates increased reflectance of red light, which in this case may be caused by artefacts of unknown origin related to the bone sutures. (B) Quantifying the spatial distribution of reflected red light indicates that the intrinsic optical signal evoked by the 10 Hz C2 whisker stimulation (red curve) has a near Gaussian profile (fitted Gaussian curve has a Gaussian width of 286 μm; full width at half-maximum 396 μm). On alternating intercalated trials, the same imaging procedure was carried out but in the absence of whisker stimulation. On these unstimulated trials, no change in reflected light was observed (blue curve). (C) The time course of the reflected light changes from a region of interest centered on the location of the C2 barrel column during trials with stimulation (red) and intercalated trials without stimulation (blue). The peak amplitude of the intrinsic signal in this experiment was ∼0.06%. (D) In a different mouse, the cortex was imaged at higher magnification through the intact skull. The C1, C2, or C3 whisker was stimulated evoking intrinsic signals located in different positions in agreement with the somatotopic layout of barrel cortex. (E) The spatial extent of the intrinsic signal was quantified along a ∼200 μm thick line aligned with the centers of the evoked responses. The signals were fitted with Gaussian functions and normalized in amplitude. Clear displacement of the location of the peak signal is observed in response to stimulation of different whiskers.

