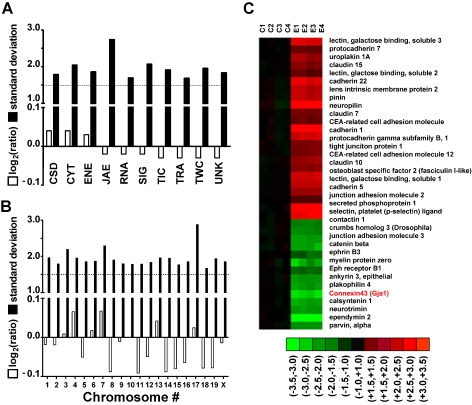
Figure 1.
Expression regulation of gene cohorts in AT-EAE mouse spinal cord. A–B. Log2ratios (negative for down-regulation) and standard deviation of expression ratios of gene cohorts sharing the same molecular function (A) or chromosomal location (B). Note that while the average fold change was less than 1.5 for all cohorts, the standard deviation of the fold change exceeded 1.5. Highest standard deviations were obtained for JAE genes and for those located on chromosome 17. (C) Heatmap of the regulated JAE-J genes. C1–C4 = logratios in the four controls, E1–E4 = logratios in the four AT-EAE mice. All logratios were computed with respect to the average expression level in control mice. Red/green/black color indicates up/down/no regulation in the respective set. Note both the reproducibility (green, red, or black color for all four sets of the same condition) and the variability (non-uniform nuance of the color) of the gene expression patterns among the animals of the same condition.

