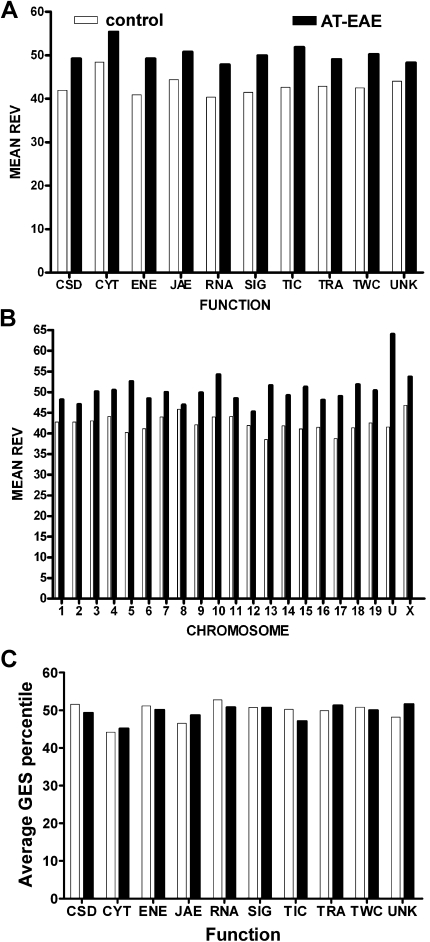
Figure 2.
Regulation of the mean relative expression variability (REV) of gene cohorts sharing the same molecular function (A) or chromosomal location (B) in spinal cords of AT-EAE mice compared to control mice. (C) Average gene expression stability (GES) of functional gene cohorts. Note the uniformity of the two REV distributions both among functional classes: REV(C) = (42.9 ± 2.3)%, REV(E) = (50.2 ± 2.3)% and among chromosomes: REV(C) = (42.5 ± 2.1)%, REV(E) = (49.7 ± 2.3)% and that all functional and chromosomal cohorts became less stably expressed (higher REV) in AT-EAE mice, with the highest increments in the transport into cell (23.8%) and chromosome 13 (34.1%). Cytoskeleton genes were the most unstably expressed in both conditions. Observe the quasi-uniform distribution of GES values among functional categories for both control and AT-EAE specimens.

