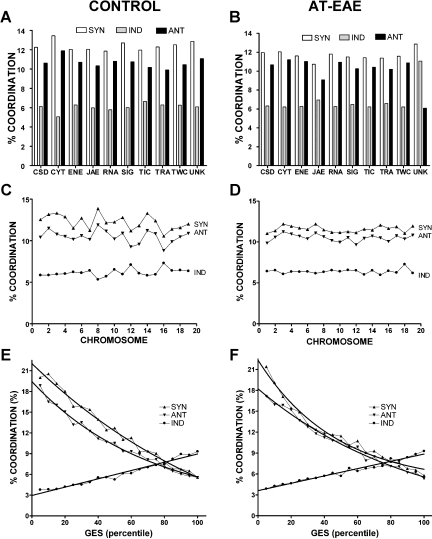
Figure 4.
Average percentages of synergistically (Syn), antagonistically (Ant), and independently (Ind) expressed gene pairs in functional categories (A and B), chromosomes (C and D) and GES percentiles for control (A, C, E) and AT-EAE (B, D, F) spinal cords. Note the quasi-uniform distributions of the percentages in functional categories and chromosomal locations in both conditions, the not-significant alteration of the percentages in AT-EAE mice and the inverse exponential relationship between synergistic and antagonistic coordination and expression stability (GES percentile).

