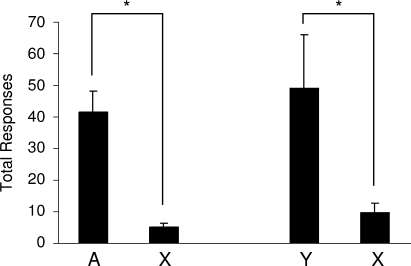
Figure 4.
Acquisition of a new response mediated by devaluation-sensitive outcome-specific representations. This graph shows the average total number of responses over two, 30 minute sessions on a VR2 schedule. Rats, represented on the left side of the graph, had access to two instrumental responses: one leading to the fully conditioned cue, A, and the other leading to the fully blocked cue, X. Rats represented on the right-side of the graph had access to two responses: one leading to the partially conditioned outcome cue, Y, and the other leading to the fully blocked cue, X. Rats responded significantly more for the conditioned cues, A or Y, than for X. (*, p < 0.05).

