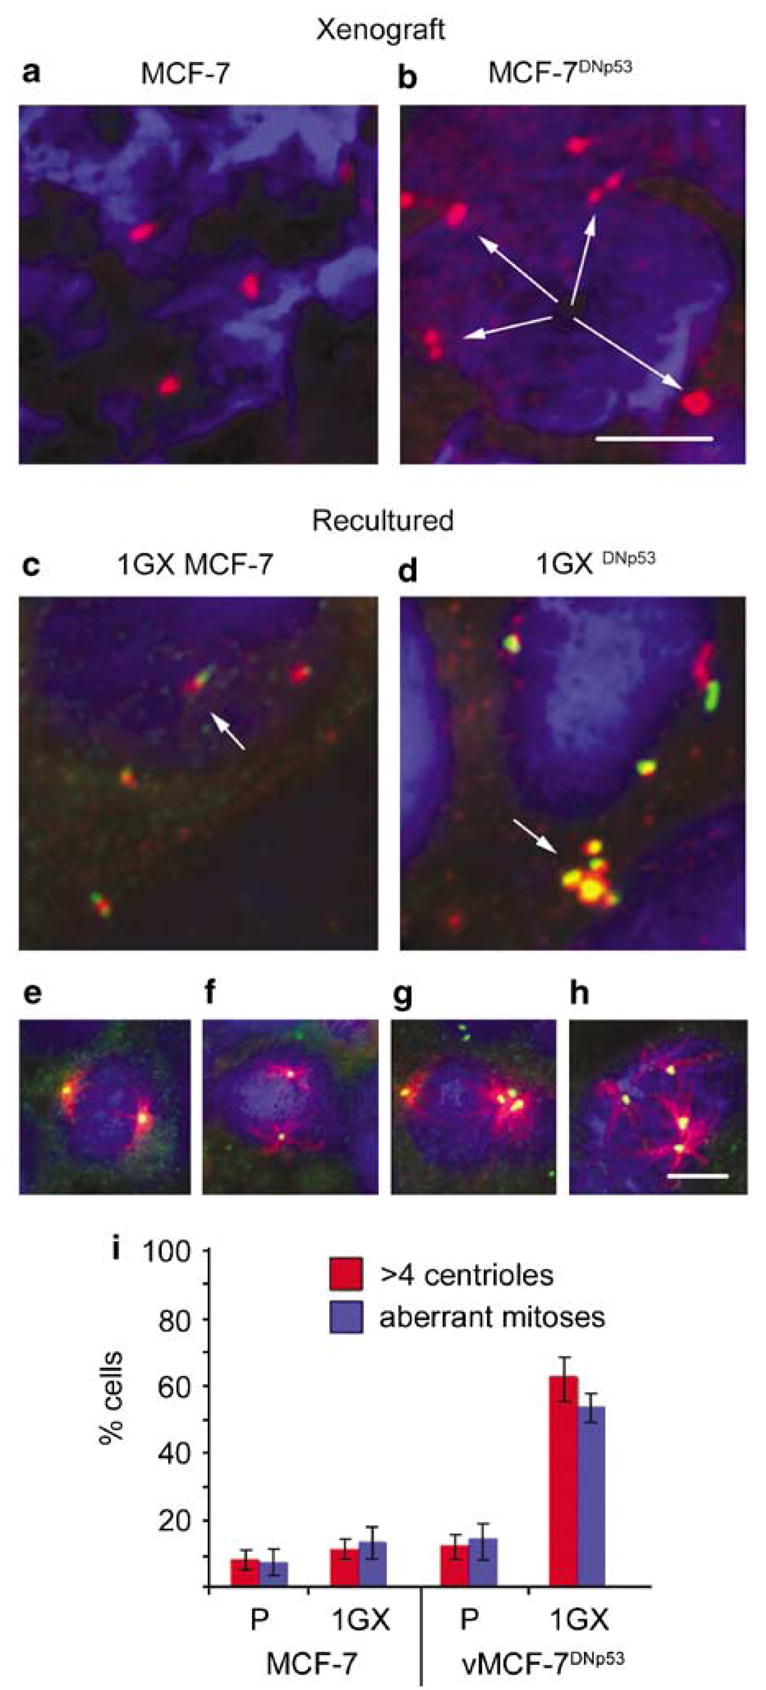
Figure 6.

Centrosome phenotype and mitotic spindle morphology in parental and first generation (1GX) cultures reestablished from xenograft tumors. (a, b) g-tubulin staining showing normal centrosomes in MCF-7 xenografts and centrosome amplification in the MCF-7DNp53 xenograft. (c, d) Centrosomes of cells from cultures reestablished from xenografts stained for centrin (green) and pericentrin (red). Normal centrosome staining (c, arrow) was maintained in 1GX cultures reestablished from MCF-7 xenografts (c) and centrosome amplification (d, arrow) was maintained in 1GX cultures reestablished from vMCF-7DNp53 xenografts (d). Bar in (b) ¼5 μm for (a–d). Normal bipolar mitotic spindle morphology in 1GX MCF-7 cells (e, f). Abnormal pseudobipolar and multipolar mitotic spindle morphology in v1GX MCF-7DNp53 cells. (g, h). Bar in (h) = 10 μm for (e–h). Graph showing centrosome characteristics (centrin and pericentrin staining) of parental vs cultures reestablished from xenografts (1GX) showing normal centrosome number and morphology in parental MCF-7, vMCF-7DNp53 and 1GX MCF-7, and centrosome amplification and abnormal mitoses in 1GX vMCF-7DNp53. Bars represent the average percentage of cells with >4 centrioles and those with aberrant mitoses from three experiments±s.d.
