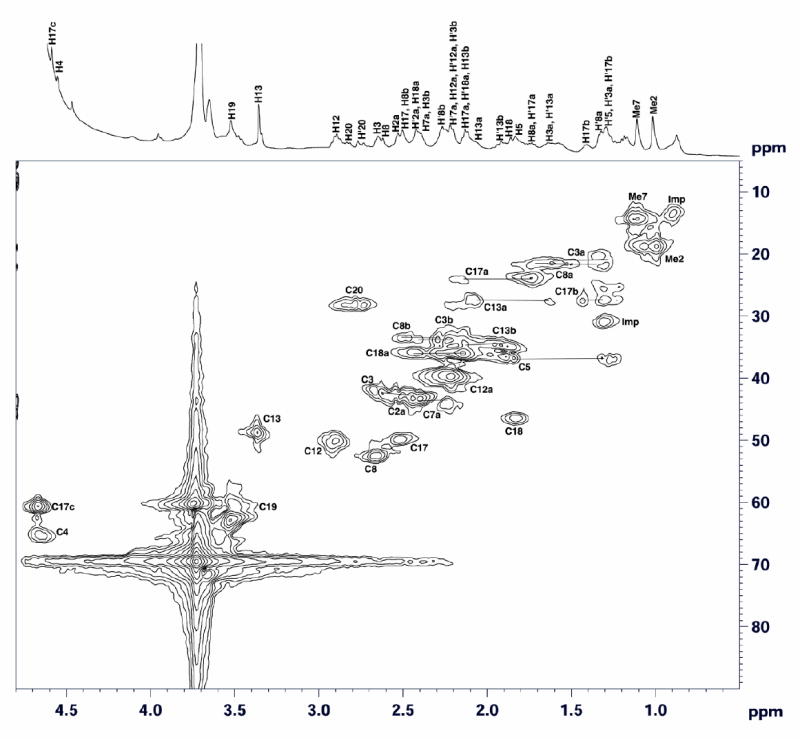
Figure 6.

Two-dimensional 1H-13C HMQC spectrum of F330 recorded in D2O at 25°C. Horizontal lines connect signals of geminal protons. Horizontal and vertical axes represent proton and carbon chemical shifts, respectively. The 1H NMR spectrum of F330 is shown at the top.
