
Figure 6.
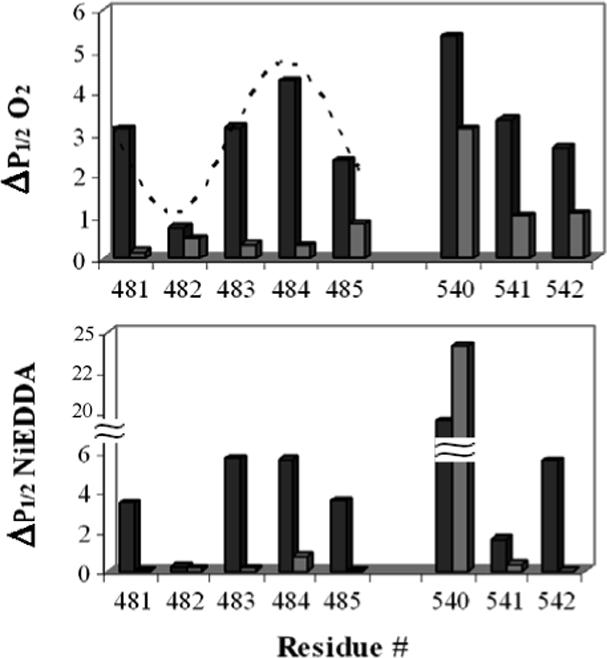
Oxygen and NiEDDA accessibility comparison for both the LSGGQ (481−485) and H-motif (540−542). The top panel shows the oxygen accessibility of the indicated positions in the resting (black bars) and vanadate trapped (grey bars) states. Lower panel shows the accessibility to NiEDDA. The dotted line overlaid on the upper graph is a sine wave with a periodicity of 3.6.