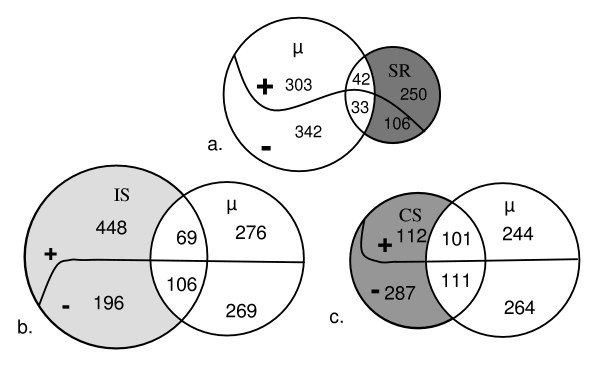
Figure 4.
Venn diagrams comparing the growth rate transcriptomic response with other stress responses in L. lactis IL1403. Growth rate (μ) is compared with stringent response (SR) (a), isoleucine starvation (IS) (b), and carbon starvation (CS) (c). + and - respectively represents genes whose expression increases or decreases when growth rate decreases. The missing probes of the various transcriptomic datasets were removed from the diagrams.

