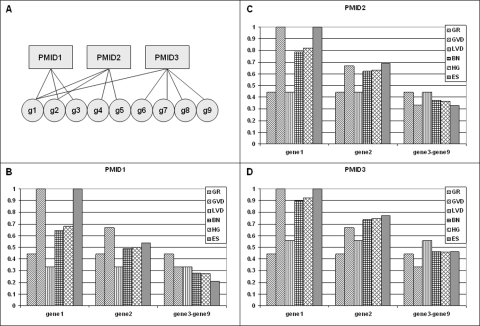
Figure 1. Bipartite graph data representation and null-models.
A) PubMed IDs (PMIDx) and genes (gx) are represented by vertices of a bipartite graph. An edge indicates that a gene has been reported as differentially regulated in a specific publication. B–D) Occurrence probabilities of the bipartite graph shown in panel A as determined by six different null-models for PMID1 (B), PMID2 (C) and PMID3 (D): GR - generic randomization, GVD - gene vertex degree, LVD - list vertex degree, BN - binomial, HG - hypergeometric, ES - edge-swapping. See text for details of different null-models.

