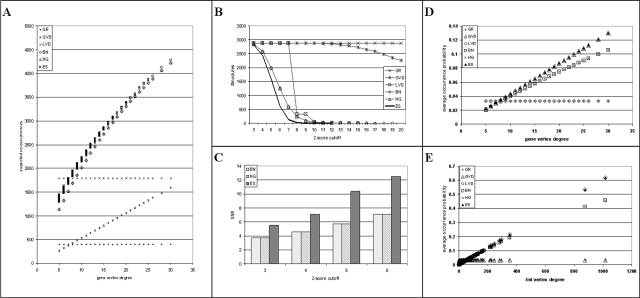
Figure 2. Properties of different null-models.
GR - generic randomization, GVD - gene vertex degree, LVD - list vertex degree, BN - binomial, HG - hypergeometric, ES - edge-swapping. A) Expected number of co-occurrences in PubLiME data set: scatter plot of gene vertex degree against expected number of co-occurrences is shown. The expected number of co-occurrences of a gene is calculated as the sum of expected co-occurrences per list over all lists. The expected number of co-occurrences per list is given by list-vertex degree minus 1 times the occurrence probability of the gene in that list. B) Number of co-occurrence modules of size 3 present in at least 5 publications as a function of Poisson-binomial Z-score in the PubLiME data set. C) Signal-to-noise ratio (SNR) calculated as the number of modules in the real bipartite graph divided by the mean number of modules in 5 randomized bipartite graphs. D) Average occurrence probability of genes with the same vertex degree as a function of gene vertex degree. E) Average occurrence probability in lists with the same vertex degree as a function of list vertex degree.

