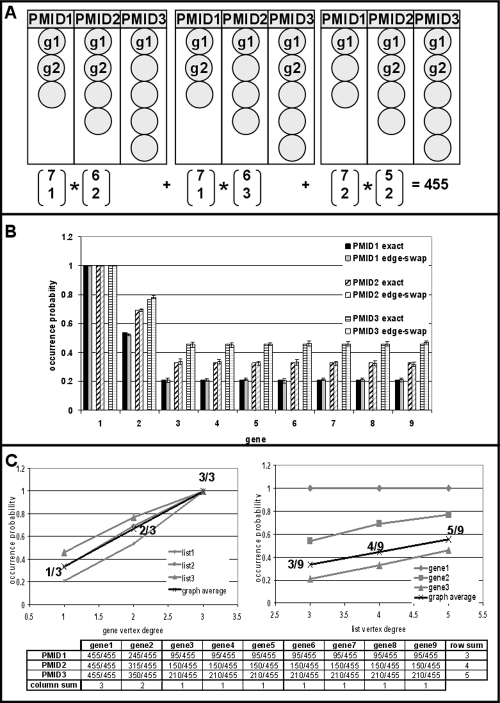
Figure 3. Edge-swapping as sampling from a complete bipartite graph permutation set.
A) Calculation of the size of the permutation set of the graph shown in Fig. 1A. B) Precision of edge-swapping. Occurrence probability estimates are compared to their true values. See text for details. C) Individual and average occurrence probabilities are shown as a function of gene (left panel) and list (right panel) vertex degrees. The exact numbers of occurrences of each gene in each list are shown at the bottom and have been used to calculate exact occurrence probabilities. Note that row and column sums are adding up to vertex degrees. As a consequence, the average occurrence probability is a linear function of both gene and list vertex degrees.

