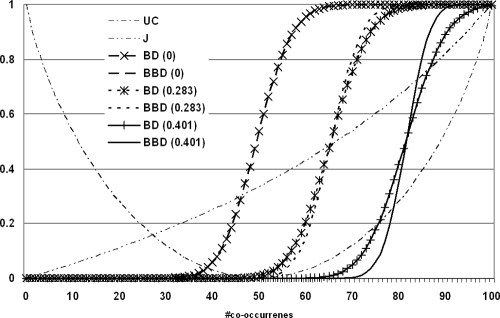
Figure 5. Comparison of measures of association.
Two genes are assumed to occur in 100 out of 200 lists with occurrence probabilities that are constant (standard deviation 0), vary slightly (standard deviation 0.283) or strongly (standard deviation 0.401) from list to list. For each possible number of co-occurrences from 0 to 100, the uncertainty coefficient (UC), the Jaccard coeffcient (J), and the bi-binomial cumulative distribution function are calculated (BBD). For comparison purposes, the cumulative distribution function of the binomial distribution (BD) is calculated from the average co-occurrence probabilities, which are obtained by multiplying the occurrence probabilities of the two genes. Note that the expected number of co-occurrences depends on the variability in occurrence probabilities and that the same value of J and UC can be associated with positive, negative, or absence of association.

