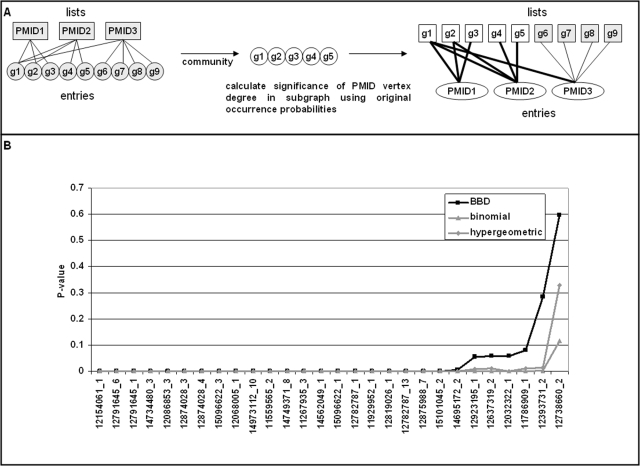
Figure 7. Lists associated with cell cycle cluster.
A) Association is calculated as the cumulative bi-binomial probability of observing a given number of occurrences of an entry of interest in a subset of lists. When the subset of lists to be analyzed for association is derived from a community of entries, the underlying bipartite graph must be reversed such that entries become lists and vice versa. Occurrence probabilities for the transformed graph are obtained by transposing the occurrence probability matrix. B) The cumulative P-value of PubLiME publications reporting 37 genes of the cell cycle community (Figure 6A) is calculated using BBD, binomial and hypergeometric statistics. The lists are sorted by ascending P-value. BBD statistics are obtained following the scheme shown in panel A. Binomial and hypergeometric statistics are calculated as: Number of success: the number of cell cycle genes reported by the list. Number of trials: the number of genes reported in the cell cycle cluster. Probability of success: list length divided by 7358 total genes in the PubLliME data set used to generate the co-occurrence network.

