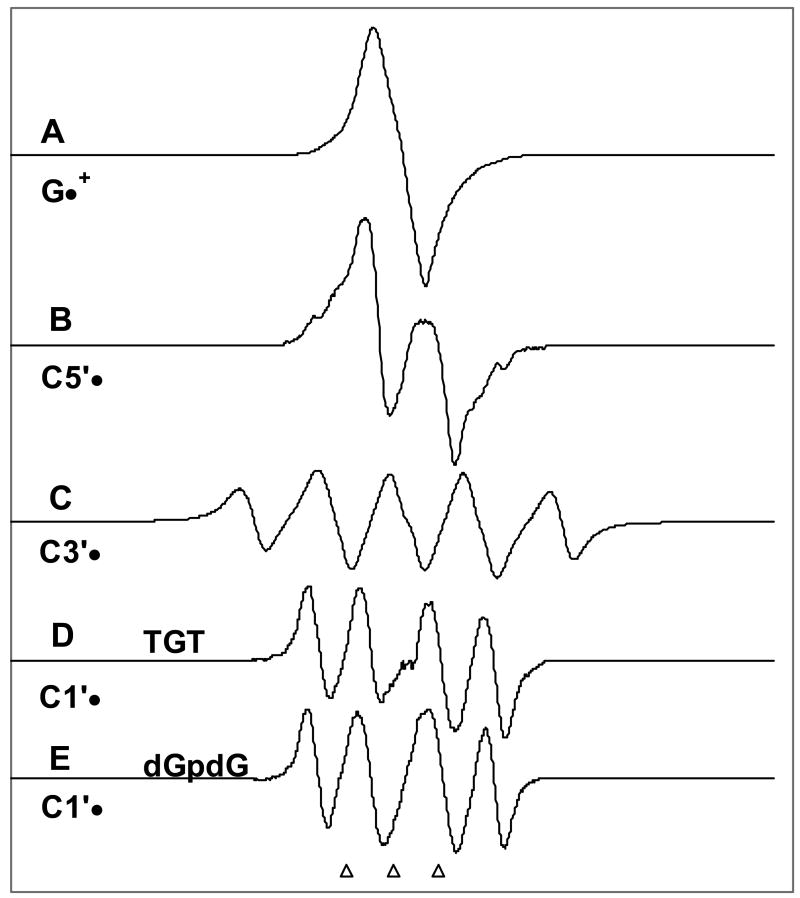
Figure 1.
Benchmark spectra used for computer analysis. (A) G•+ in dGpdG by one-electron oxidation by Cl2•– (see Figure 2A also). (B) C5′•, formed via photo-excitation of G•+ in 8-D-3′-dGMP.14 (C) C3′•, produced from G•+ in dGuo.14 (D) C1′•, produced from G•+ in TGT. (E) C1′•, produced from G•+ in dGpdG. (see supporting information Figure S1 for details regarding Figures 1D and 1E). The three reference markers in this figure and in the other figures in this work represent positions of Fremy's salt resonances (The central marker is at g = 2.0056 and each of three markers is separated from one another by 13.09 G).

