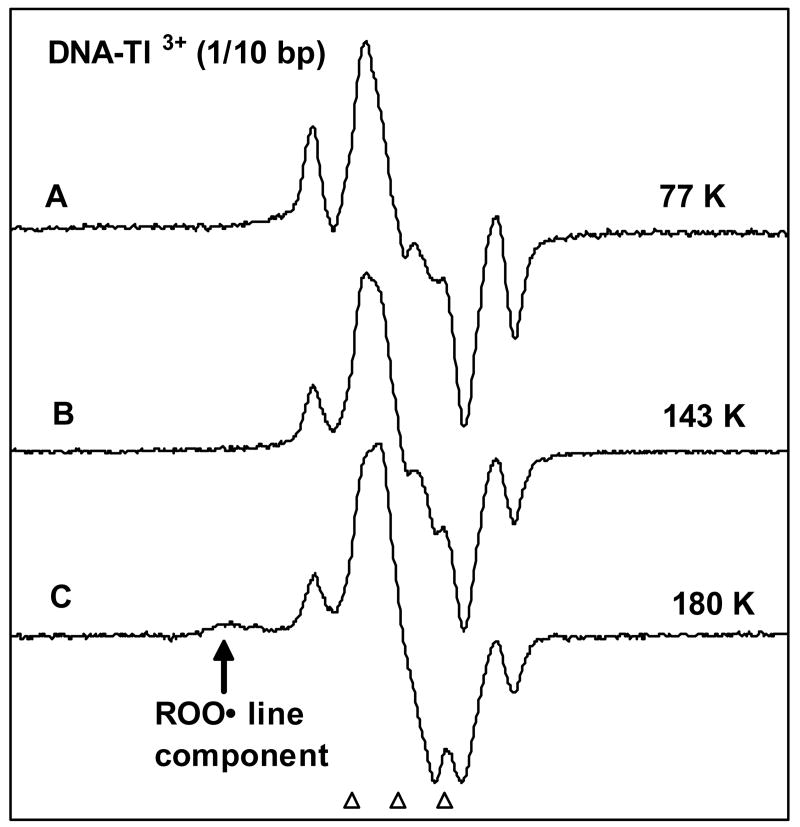
Figure 4.
Ice samples of DNA (50 mg/mL in D2O) with 1 Tl3+/10 base pairs were γ-irradiated to 15.4 kGy dose at 77 K and were then annealed to 130 K to remove the •OH signal. (A) ESR spectrum obtained after illumination with the aid of a high pressure Xe lamp (Oriel corporation), at 77 K for 110 min with 380-480 nm band-pass filter.14 (B) After photo-excitation using a 250 W photoflood tungsten lamp of an identically prepared and handled sample as in A at 143 K for 90 min without any filter. (C) After illumination by the same photoflood lamp of another identically prepared and handled sample as in A and B at 180 K for 90 min. Spectrum (C) also shows outer line component of peroxyl radical which decreases the intensity of the sugar components slightly. All spectra were recorded at 77 K.

