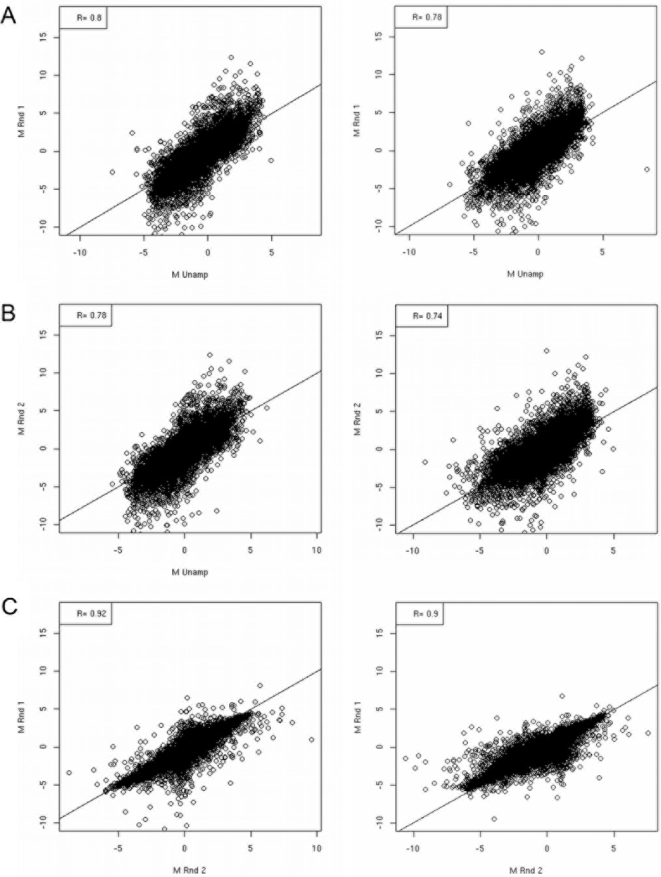
Figure 2. Correlation of log2 ratios resulting from comparative transcriptional analysis of the laboratory cultured A. fumigatus cell populations T0 and T60 under varying mRNA amplification protocols.
Correlation of technically duplicated log2 ratios between competitive hybridisations using single (aRNA1), double (aRNA2) and unamplified (totRNA) RNA samples. (A and B) Correlation between log2 ratios obtained using cDNA derived from amplified and total RNA (totRNA v aRNAr1 r = 0.74–0.80, totRNA v aRNAr2 r = 0.74–0.80) (C) Cross-protocol pairings revealed highest correlations between slides using cDNA derived from amplified RNA (aRNAr1 v aRNAr2 r = 0.88–0.91) Surprisingly, technical replicates of slides using cDNA derived from total RNA (totRNA r = 0.80) were comparable to cross-protocol pairings (data not shown).

