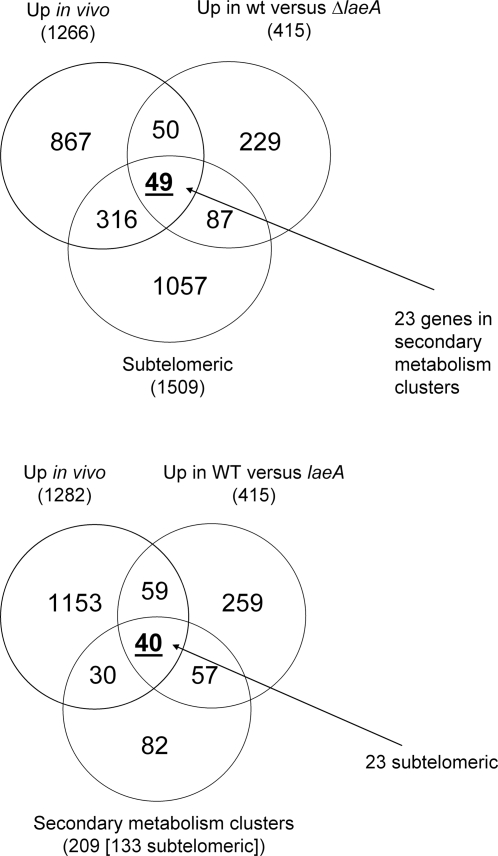
Figure 8. Expression of LaeA-regulated genes during initiation of murine infection.
Venn diagram representation of overlap between genes repressed in ΔLaeA[16] and those having increased transcript abundance during murine infection, according to proportions having subtelomeric locations, and secondary metabolism functionality (on the basis of annotation).

