Figure 3.
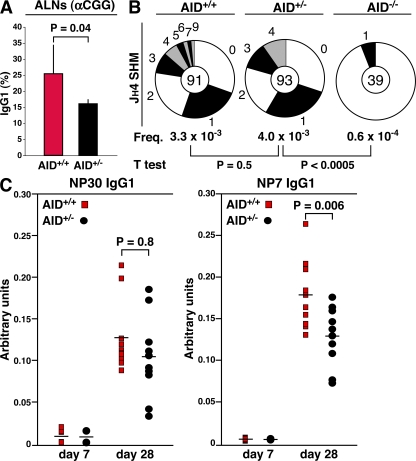
Reduced AID activity in AID+/− mice during the immune response. (A) Measurement of IgG1 levels in GCs from AID+/+ and AID+/− mice. Values represent the mean ± SD (n = 5). (B) Somatic hypermutation as determined by sequencing the JH4 intron from AID+/+, AID+/−, and AID−/− GC cells. (C) ELISA analysis of serum from five AID+/+ and AID+/− mice immunized with NP-CGG. IgG1 antibodies displaying low affinity for NP were captured in this assay using NP30-BSA, whereas high affinity antibodies were monitored with NP7-BSA, as described in Results and discussion. Horizontal bars represent the mean.

