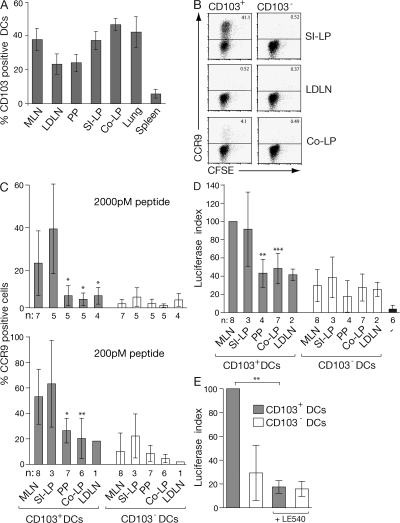
Figure 1.
Small intestinal LP and MLN CD103+ DCs are unique in their capacity to efficiently induce CCR9 on responding T cells. (A) Percentage of DCs (MHC class II+CD11c+) expressing CD103 in indicated organs. Results are the mean and SD from three to eight independent experiments (two to five mice per experiment). (B and C) CD103+ and CD103− DCs were sorted from the indicated organs by FACS, pulsed with 2 nM (B and C) or 200 pM (C) pOVA257–264, and incubated with OT-I cells. CCR9 expression on responding OT-I cells was assessed after 6 d by flow cytometry. Representative FACS plots (B) and mean and SD (C) of the indicated number of separate experiments are shown. (D and E) CD103+ and CD103− DCs were sorted from the indicated organs by FACS, pulsed with 200 pM pOVA257–264, and incubated with DR5.OT-I cells. Luciferase activity was determined after 22 h of culture. Data are normalized to the luciferase expression observed in CD103+ MLN DC:DR5.OT-I cell cultures within each experiment. −, DR5.OT-I cells alone. Results are the mean and SD of the indicated number of separate experiments. (E) Luciferase activity was blocked when 1 μM of the pan-RAR antagonist LE540 was added to MLN DC-T cell cultures. Results are the mean and SD of three experiments. *, P < 0.05; **, P < 0.01; ***, P < 0.001 (compared with CD103+ MLN DCs). LDLN, Lung draining LN; Co-LP, colonic LP.

