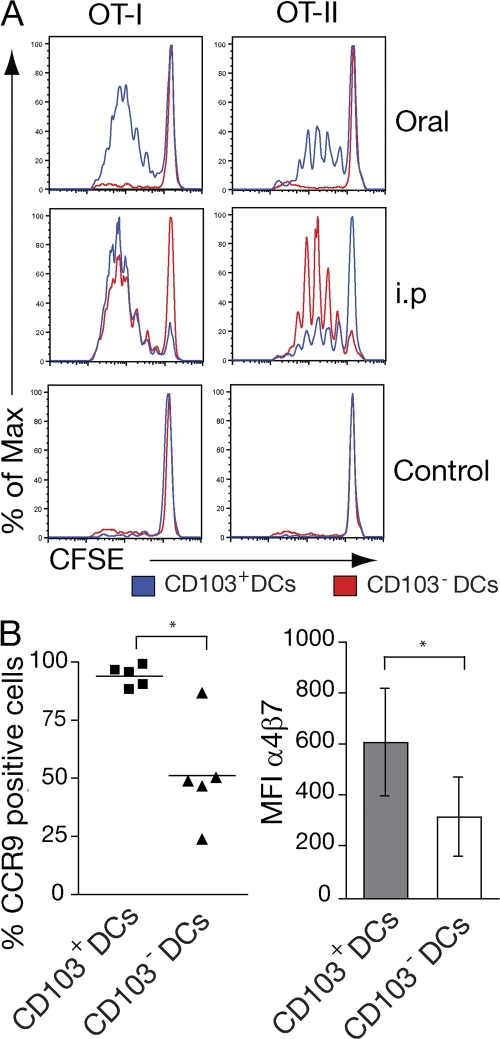
Figure 5.
CD103+ DCs present orally administered soluble antigen to CD4+ and CD8+ T cells. (A and B) Mice received PBS 5 mg OVA i.p., or 50 mg orally, and MLN were harvested after 17 h. 105 CD103+ and CD103− MLN DCs were isolated by cell sorting and cocultured with 2 × 10⁵ CFSE-labeled OT-I or OT-II cells. (A) CFSE profile of OT-I and OT-II cells 3.5 d after coculture with indicated DCs. Data are representative of three to five separate experiments using MLN DCs isolated from 15–20 pooled mice per group. (B) Expression of CCR9 and α4β7 was analyzed by FACS after 3.5 d in coculture. The graph shows mean and SEM from five independent experiments. *, P < 0.05 (when comparing CD103+ and CD103− DC–primed cultures).

