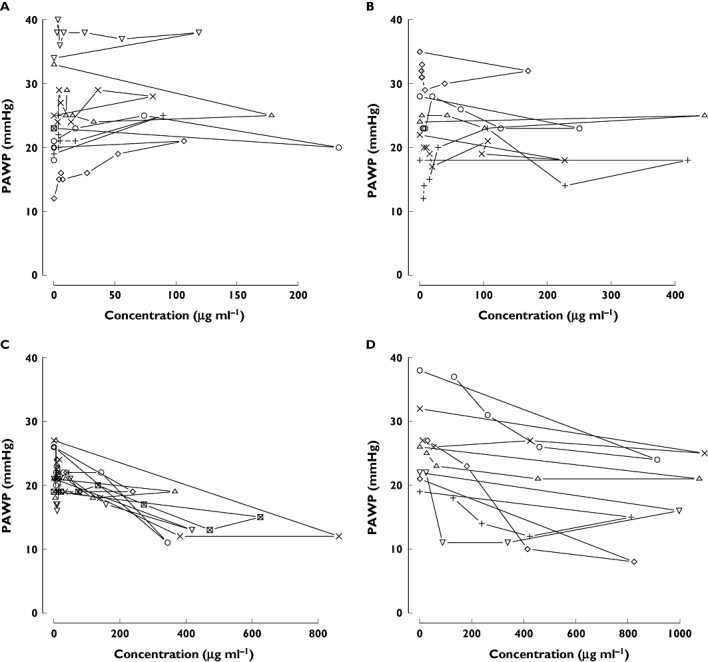
Figure 6.

Concentration–effect (PAWP) plots of nicorandil. These data were obtained from a bolus injection study of patients with AHF. PAWP was measured using a Swan-Ganz catheter. Concentrations of nicorandil were measured by HPLC. Each plot shows individual data. Panels A, B, C, and D show a 4, 8, 12 and 18 mg kg−1 bolus dose of nicorandil
