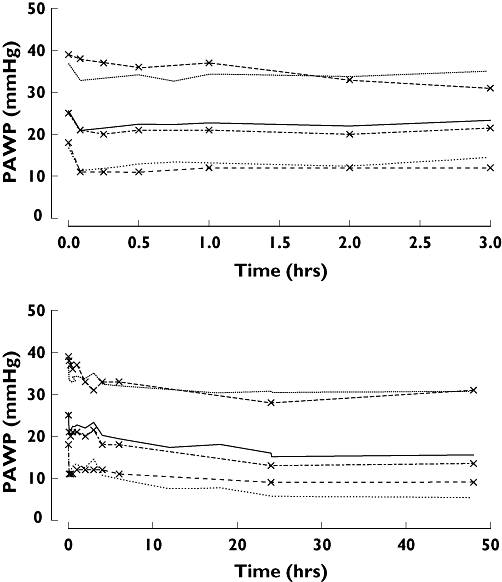
Figure 10.

Visual predictive check of PKPD model 10 in patients with acute heart failure for PAWP (lines with symbols are observations and without symbols are predictions; median is thick line, 90% prediction intervals are thin lines). Low ( ), median (
 ), high (
 ), OBS low (
 ), OBS median (
 ), OBS high (
 )
)
