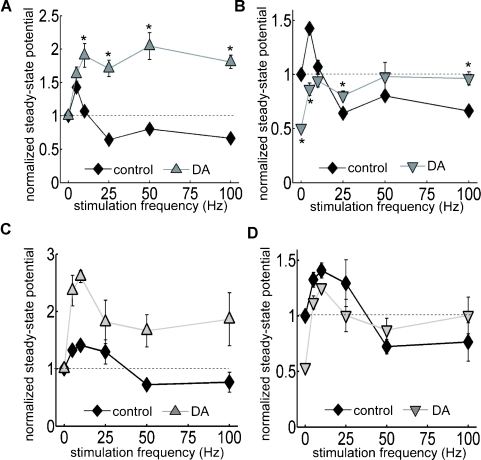
Figure 6.
Analysis of DA-induced filtering at TA-CA1 synapses at room and near physiological temperatures. (A) Using same data as in Figure 5, steady-state potentials were measured. In the presence of DA, the steady-state potential became larger during HFS. p < 0.05 relative to control (from left to right; control: n = 5, 5, 7, 6, and 5, DA: n = 5, 5, 5, 5, and 5). (B) As in Figure 5B, data were normalized to baseline fEPSP amplitude prior to DA application. Thus, this figure shows the total effect of DA, including on the depression of basal synaptic transmission. Under DA application, although the steady-state potential was smaller during low-frequency stimulation, it overcame the depression and became larger than control during HFS. p < 0.05 relative to control. Note that control error bars are smaller than the symbol size. (C) Similar experiments as A conducted at higher temperature (32–34°C). (D) Similar analysis as B, using data acquired at higher temperature.

