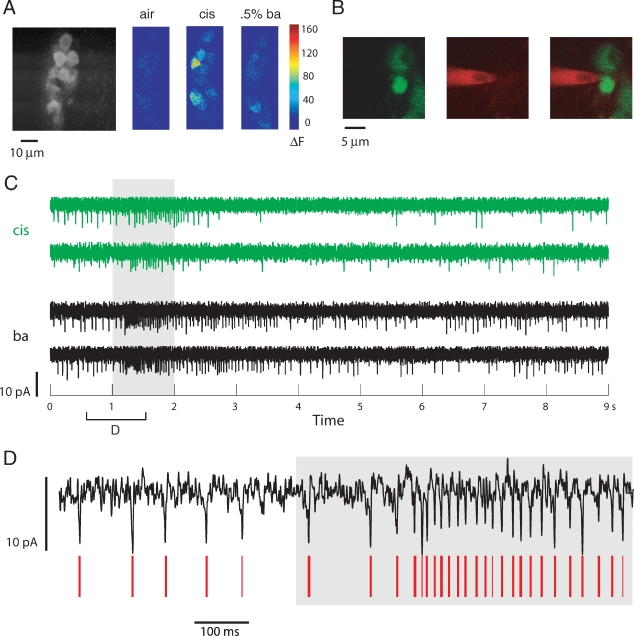
Figure 1.
Loose-patch recording from identified PNs in GH146-Gal4, UAS-GCaMP flies. (A) Baseline levels of fluorescence (left) of G-CaMP-expressing dorsal PNs, and absolute changes in (8-bit) fluorescence intensity levels in response to air and two odor presentations. (B) Two-channel imaging showing (from left) images in the green, and red channels; image on right is an image created from merging the two channels. Images verify that cell was not broken into during recording. (C) Current traces from the PN above. Shown are responses to two different odor presentations (two trials each) (gray bar). (D) Spikes, although small, can be separated from the noise by a combination of amplitude and fast deflection (see Materials and Methods). Red lines indicate spikes detected automatically.

