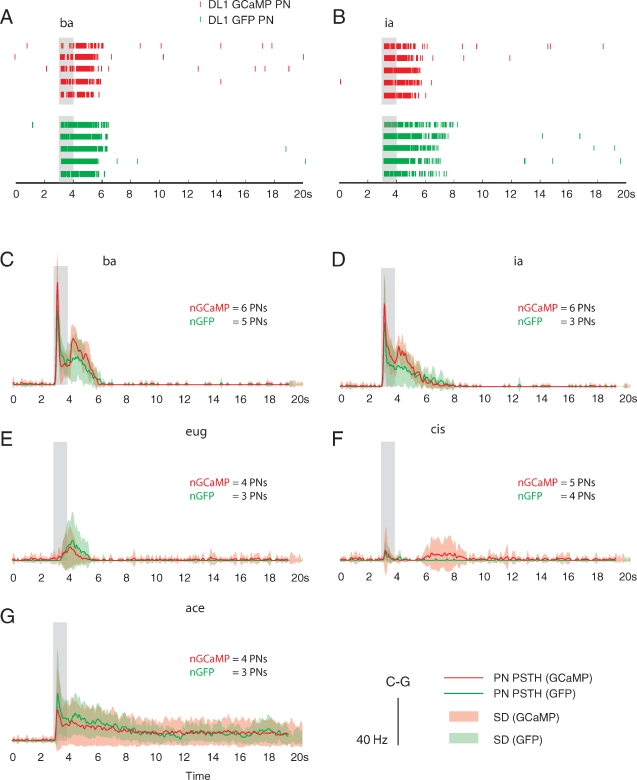
Figure 2.
G-CaMP-expressing PNs (of the DL1 glomerulus) and their GFP-expressing counterparts do not show significantly different response patterns. (A–B) Sample responses of two PNs. The first five rows show spike rasters of single trial responses of a G-CaMP-expressing PN (NP3529-Gal4, UAS-GCaMP) fly, and the next five show responses of a GFP-expressing PN (NP3529-Gal4, UAS-eGFP) to ba and ia respectively. (C–G) Shown are mean PSTHs for DL1 PN: GFP (in green, with SD in light green) and G-CaMP (in red; SD in pink). PN spiking responses to different odors shown were smoothed (5 ms width Gaussian) before trial-averaging to produce PSTHs. G-CaMP PN responses were almost always within one SD of GFP PN responses (see stats in text).

