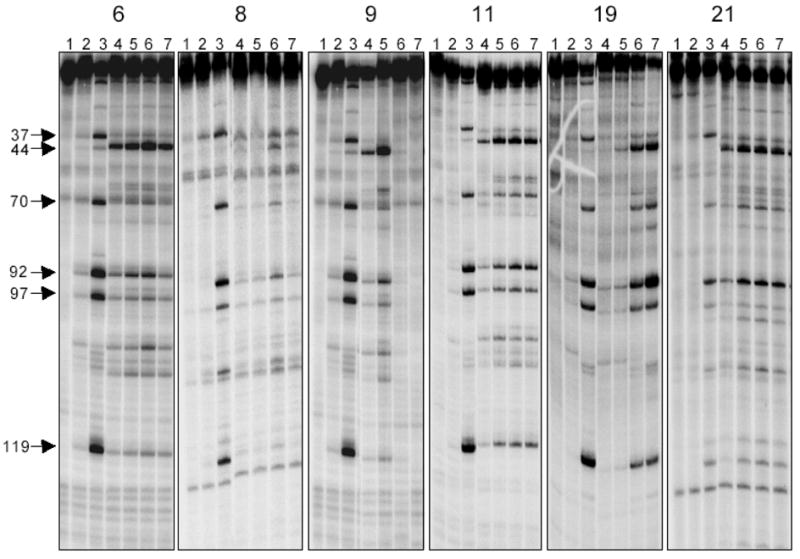
Figure 4.

Comparison of the Top1-mediated DNA cleavages at different drug concentrations. The DNA used corresponds to the 3′-end-labeled PvuII/HindIII fragment of pBluescript SK (−) phagemid DNA. Top1 was present in all reaction mixtures except Lane 1. Lane 1: DNA; Lane 2: DNA + Top1; Lane 3: 1 μM camptothecin; Lanes 4–7: inhibitor concentrations of 0.1, 1.0, 10, and 100 μM, respectively. The figure is comprised of 5 gels that are placed side by side to facilitate comparison.
