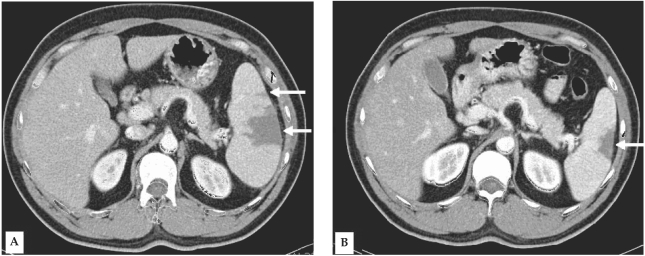
Fig. 1.
Contrast-enhanced computed tomography (CT) of the abdomen reveals multiple areas of low attenuation density in the enlarged spleen (arrows) (A). Follow-up CT acquired 10 weeks after the initial CT demonstrates partial resolution of the large segmental infarction (arrow), and complete resolution of the small infarcted areas (B).

